This is probably one of the concepts that trips many new students in Statistics. But before we go further, let’s first understand what standard deviation is.
In any dataset, whether it’s the entire population or just a sample from it, the mean is the simple sum of all the values divided by the number of values. Here’s an example with five numbers:
\frac{48+49+50+51+52}{5}=50Example A
As you can see, 50 is the average of those five numbers. If I tell you the average without showing you the numbers, you’d assume the values are somewhere around 50—which in this case is true. However, the average doesn’t tell us the whole story. Let’s look at another example:
\frac{1+5+10+134+100}{5}=50Example B
The average is still 50, but the numbers are not close to 50 at all. They fluctuate significantly. This can lead to misjudgments and false perceptions of the data. That’s where standard deviation comes in. Standard deviation measures the average amount of fluctuation around the mean, so even without knowing the actual numbers, you get a better idea of how spread out they are.
In Example A, the standard deviation is 1.58, while in Example B it is 62.41. I won’t go into the formulas in this article, but here’s what those numbers mean:
- In Example A, the values fluctuate roughly between 48 (50 − 1.58) and 52 (50 + 1.58). This tells us the numbers are very close to the mean.
- In Example B, the values fluctuate roughly between −12 (50 − 62.41) and 112 (50 + 62.41). This tells us the numbers are scattered far from the mean.
I say “roughly” or “probably” because extreme outliers can still influence these ranges. Of course, there are other statistics that help us better understand central tendencies, but that’s for another article.
If we always had access to the whole population, this would be the end of the article. We wouldn’t need standard error. But unfortunately, in most cases, we don’t have access to the population because collecting it is costly or even impossible. For that reason, we usually take a sample and try to infer what the population looks like.
Now, what I’m about to say never stops to fascinate me. Theoretically, if we take all possible samples from a population and calculate the mean of each sample, the average of those sample means would be exactly the same as the population mean—not just close, but exactly.
However, we cannot take all possible samples, because that would be even harder than examining the entire population. So why does this matter? Well, it turns out that with just one sample, we can still estimate the population parameters with quite good accuracy. But how accurate? Well, ladies and gentlemen, meet Standard Error!
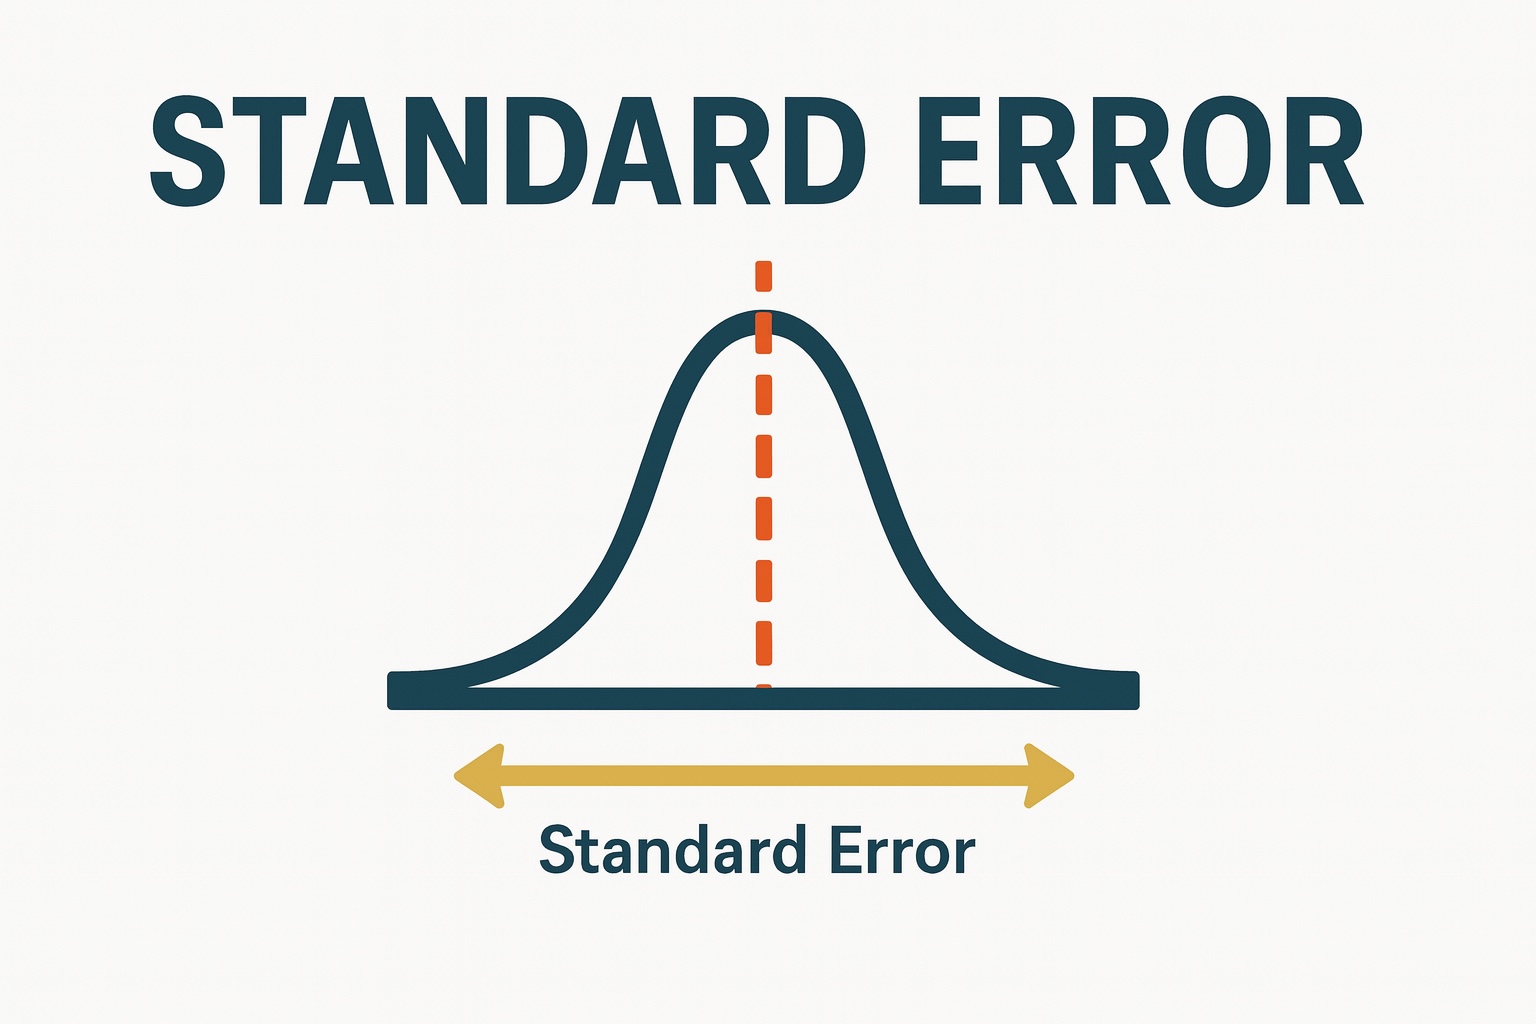
As I said, the mean of all possible sample means equals the population mean. But since we usually can’t take all possible samples, we should expect some fluctuations when calculating sample means. In our earlier examples, the standard deviation told us how much the data values fluctuated. Now imagine instead that those numbers were sample means. Then, the standard deviation of those means would tell us how much we should expect our sample mean to deviate from the true population mean. Statisticians gave this concept a special name (Standard Error), so we don’t confuse it with the standard deviation of raw data.
