If you’ve taken any statistics courses before, there’s a good chance you’ve heard these two terms: Sample Distribution and Sampling Distribution. Because the terms sound so similar, it’s easy to think they mean the same thing. However, they actually refer to two different distributions, and not understanding the difference can cause confusion in more advanced statistical courses. So without further ado, let’s dive in.
In statistics, when we don’t have access to the entire population of interest, we take a sample to study instead. Often, what we want to know is the population mean. Of course, there are other reasons for taking a sample, such as hypothesis testing, but for this article we’ll focus on understanding the population mean.
Once we’ve taken a sample from the population, the mean and standard deviation are two of the most common tools for describing it. The mean tells us where the center of the data lies, while the standard deviation tells us, on average, how far each data point is from that center.
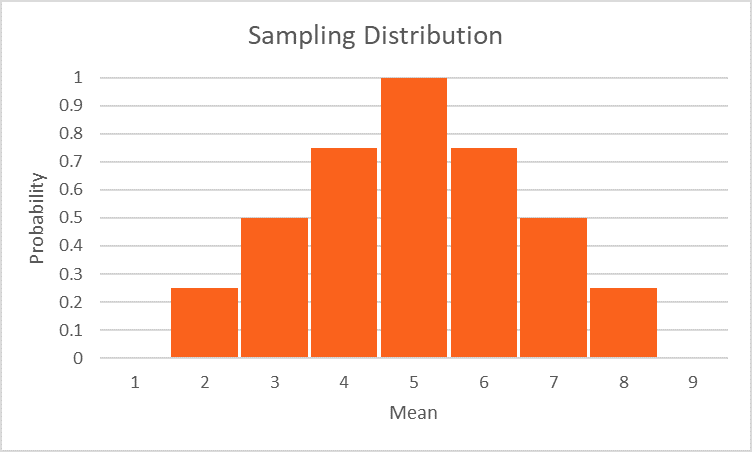
In general, a distribution shows how the values in your dataset are arranged or spread out. A sample distribution is simply the distribution of values in your sample. A sampling distribution is different: each data point in a sampling distribution comes from a statistic (for example, the mean) of a sample distribution. That can sound abstract, so let’s break it down with an example.
Suppose we’re interested in the average age of all students currently enrolled in the Graduate School of Management at UC Davis. One way to do this would be to collect the age of every student and calculate the overall mean. But in most cases, this isn’t possible. Instead, we can take a sample from the population. Imagine taking all possible samples of a certain size (say, 50 students) and calculating the mean age for each sample. The collection of all those sample means forms what’s called a sampling distribution. Here’s the magical part: if we take the average of those sample means, we get the exact population mean — not close, not approximate, but exact! Mathematically,
\mu_{\bar{x}} = \muTo wrap up: a sample distribution is the distribution of values in one sample taken from the population, while a sampling distribution is the distribution of a statistic (such as the mean) across all possible samples from the population. In practice, we can’t usually take all possible samples, but even one sample can provide a good estimate. We can estimate the population mean and the standard error using the following formulas:
\hat{\mu} = \bar{x}\hat{\sigma}_{\bar{x}} = \frac{s}{\sqrt{n}}