I have an academic background in business. Generally, statistics play a big role in business decisions. Usually, when executive managers face a strategic decision, they rely on data to make sure they understand the consequences of the outcome.
Statistics play a big role in analyzing data. Often, a business decision boils down to a yes/no question of whether to pursue some opportunity. Suppose that a business owner wants to provide free delivery on all purchases on their website. Suppose also that in order for this service to be profitable, the average shopping bag should be more than $85.
To test this statistically, we first need to formalize our hypothesis. In our example, we want to see if, on average, the shopping cart of customers is higher than $85. That’s our alternative hypothesis. Formally:
H_0:\mu \le85 \\H_1: \mu > 85
Our goal is to gather enough evidence (data) to support the alternative hypothesis (H_1). Two things can happen: we either gather enough data to reject the null hypothesis, or, based on the data, we fail to reject it. But there’s a problem: we live in a world of uncertainty. And since statistics is built on probability theory, most of the time we cannot claim something with 100% certainty. So we need a level of confidence that we are making the right decision. That level of confidence is called the level of significance, or Alpha (\alpha).
Alpha directly determines the risk of rejecting the null hypothesis when it is actually true. This error, which can be costly, is commonly known as a Type I error. In our example, if we reject the null hypothesis, it means we have enough data to show the average shopping bag of our customers is more than $85. As a consequence, the business owner starts investing in their endeavor — but if we committed a Type I error, it’s going to be a costly mistake. That’s why another name for Alpha is the risk level.
But there’s another error we can make. There’s a chance that we fail to reject the null hypothesis — which means we reject the alternative hypothesis — even though the null is actually false. This is known as a Type II error, and it can result in opportunity loss. In our example, if our data mistakenly shows that the average customer shopping cart is less than or equal to $85, then the business owner won’t invest in their endeavor and will lose the opportunity to make a good investment. This type of error is denoted by \beta. Although the risk of making a Type II error is usually smaller than that of a Type I error, it still carries real consequences.
To calculate the probability of \beta we first need to understand the distributions under H_0 and H_1. Assuming H_0 is true, the sample comes from the same distribution as H_0. This makes it harder to mistakenly reject the null hypothesis. However, if H_0 is false, depending on where the true mean lies, it might be easier to mistakenly fail to reject the null hypothesis and make a Type II error. This might sound a little abstract, so let’s clarify with an illustration.
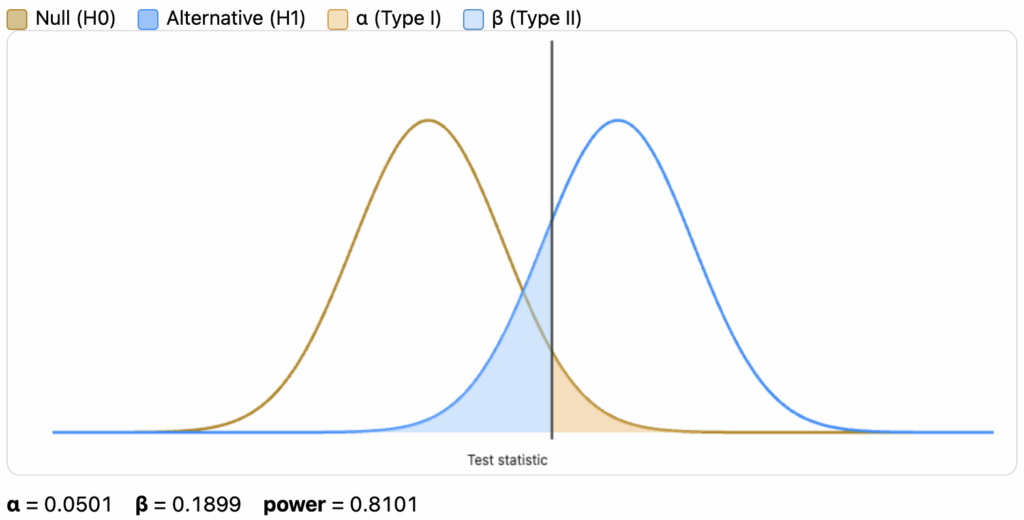
In this illustration, the null hypothesis is shown in dark yellow. Assuming our alternative hypothesis (in dark blue) is true, there’s a chance that our data fails to detect the difference, causing us to fail to reject the null hypothesis. That chance is highlighted in blue. The power of a statistical test is the complement of Beta — the chance of not making a Type II error (1 – \beta) — which is known as statistical power.
There are a few parameters that affect Beta. The probability of committing a Type II error depends on five factors: (i) the actual value of the population parameter being tested, (ii) the level of significance selected, (iii) the type of test (one- or two-tailed) used to evaluate the null hypothesis, (iv) the sample standard deviation (also called the standard error), and (v) the sample size (Sharma, Business Statistics, 2nd ed.).
To illustrate this, I created an interactive graph that shows how Beta changes when any of the parameters are adjusted. Try experimenting with it to get a clearer feel for the concept.